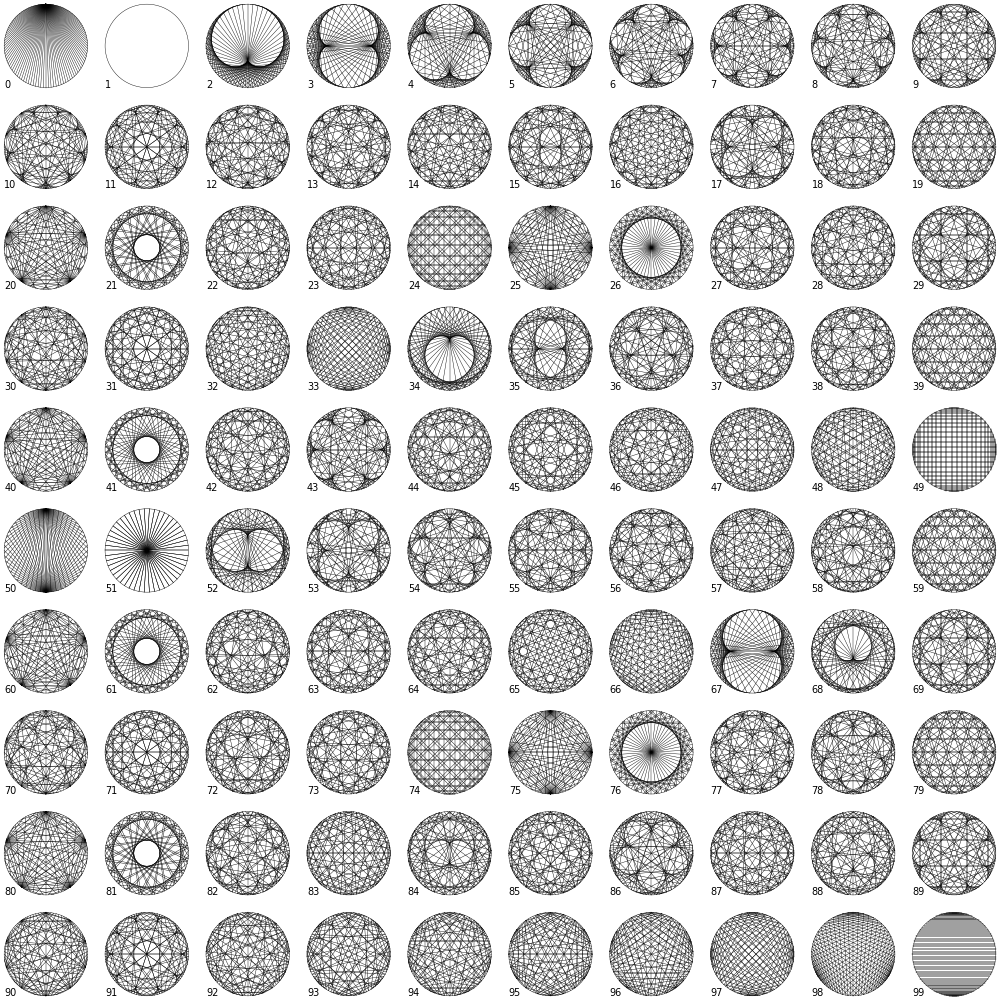
Times table ()

[sketch]
- Tools: Python, JavaScript, p5.js
- Source code: https://github.com/vec2pt/py-sketches
- Inspirations:
from pathlib import Path

import matplotlib
import matplotlib.pyplot as plt
import numpy as np

# matplotlib.use("TkAgg")
matplotlib.use("svg")


def times_table(factor: int = 2, points: int = 100) -> np.ndarray:
    """Times table

    Args:
        factor (int, optional): Factor. Defaults to 2.
        points (int, optional): Number of points. Defaults to 100.

    Returns:
        np.ndarray: Lines
    """
    lines = np.zeros((2, 2, points))
    angles = np.linspace(0, 2 * np.pi, points + 1)[:-1]

    for i in range(points):
        end_point_index = factor * i % points
        lines[0, 0, i] = np.sin(angles[i])  # Start point X
        lines[0, 1, i] = np.sin(angles[end_point_index])  # End point X
        lines[1, 0, i] = np.cos(angles[i])  # Start point Y
        lines[1, 1, i] = np.cos(angles[end_point_index])  # End point Y
    return lines


def export_times_table() -> None:
    """Exports 'Times table' board of 10 by 10 size to PNG format image."""
    fig, ax = plt.subplots(nrows=10, ncols=10, figsize=(10, 10), dpi=100)

    for i, row in enumerate(ax):
        for j, col in enumerate(row):
            col.plot(*times_table(i * 10 + j), color="k", linewidth=0.3)
            circle = plt.Circle(
                (0, 0), radius=1, fill=False, color="k", linewidth=0.3
            )
            col.add_patch(circle)
            col.text(-1, -1, str(i * 10 + j), fontsize=7)
            col.axis("off")
    plt.subplots_adjust(
        left=0, bottom=0, right=1, top=1, wspace=0.1, hspace=0.1
    )

    file_path = Path(__file__).parent / "times_table.png"
    plt.savefig(file_path)


if __name__ == "__main__":
    export_times_table()
